Congress Stock Trades
● Updated Sep 28, 2026 Refreshed 3× daily
What US politicians are buying and selling, straight from their official House disclosures. 24,145 trades tracked across 257 members.
Multiple members just bought these
Several members of Congress disclosed buying the same stock in the last 90 days — the strongest signal this data has. See all 21 cluster buys →
Latest disclosed trades
| Disclosed | Politician | Ticker | Type | Amount | Traded |
|---|---|---|---|---|---|
| Sep 22, 2026 |  Pete Sessions R Pete Sessions R |
AAPL | Sale | $100,001 | Sep 22, 2026 |
| Sep 18, 2026 | Pete Sessions R |
ABBV | Sale | $15,001 | Sep 14, 2026 |
| Sep 18, 2026 | Pete Sessions R |
GOOGL | Sale | $15,001 - $50,000 | Sep 14, 2026 |
| Sep 17, 2026 |  David J. Taylor R David J. Taylor R |
PG | Purchase | $1,001 - $15,000 | Sep 8, 2026 |
| Sep 15, 2026 | RWRichard W. Allen | AVGO | Purchase | $1,001 - $15,000 | Aug 12, 2026 |
| Sep 15, 2026 | RWRichard W. Allen | ROL | Sale | $15,001 - $50,000 | Aug 12, 2026 |
| Sep 15, 2026 | RWRichard W. Allen | TSM | Purchase | $1,001 - $15,000 | Aug 12, 2026 |
| Sep 14, 2026 | 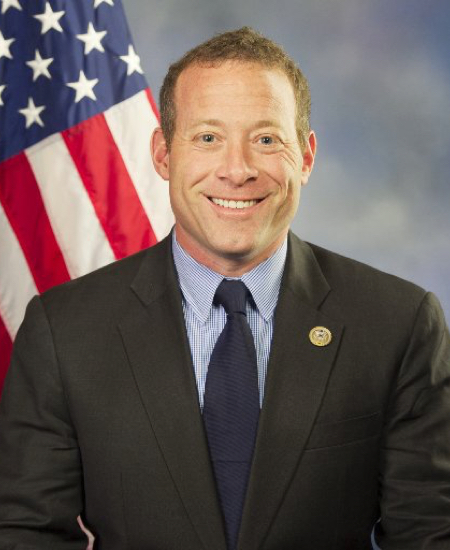 Josh Gottheimer D Josh Gottheimer D |
AMAT | Purchase | $1,001 - $15,000 | Aug 6, 2026 |
| Sep 14, 2026 | Josh Gottheimer D |
QSR | Purchase | $1,001 - $15,000 | Aug 6, 2026 |
| Sep 11, 2026 | 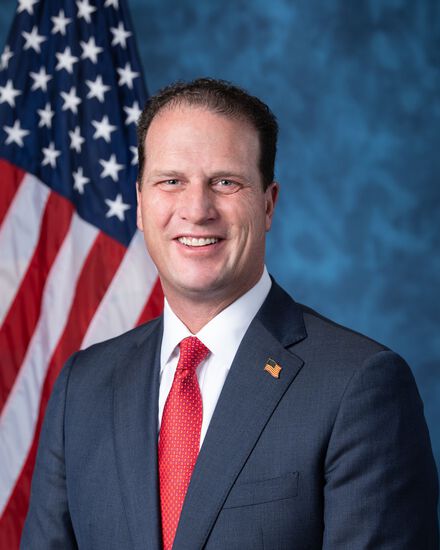 August Lee Pfluger R August Lee Pfluger R |
CHTR | Exchange | $1,001 - $15,000 | Aug 20, 2026 |
| Sep 11, 2026 | August Lee Pfluger R |
CHTR | Exchange | $1,001 - $15,000 | Aug 20, 2026 |
| Sep 11, 2026 | August Lee Pfluger R |
LBRDK | Exchange | $1,001 - $15,000 | Aug 20, 2026 |
| Sep 11, 2026 | August Lee Pfluger R |
LBRDK | Exchange | $1,001 - $15,000 | Aug 20, 2026 |
| Sep 9, 2026 | David J. Taylor R |
IBP | Purchase | $1,001 - $15,000 | Sep 8, 2026 |
| Sep 8, 2026 |  Lloyd Doggett D Lloyd Doggett D |
PG | Purchase | $1,001 - $15,000 | Aug 17, 2026 |
| Sep 4, 2026 | 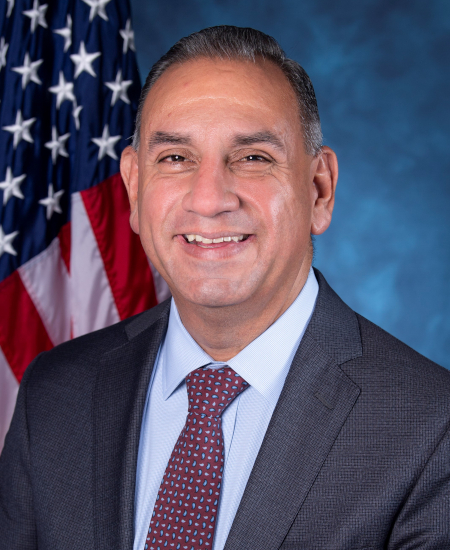 Gilbert Cisneros D Gilbert Cisneros D |
ETN | Purchase | $15,001 - $50,000 | Aug 27, 2026 |
| Sep 4, 2026 | Gilbert Cisneros D |
NKE | Sale | $15,001 - $50,000 | Aug 27, 2026 |
| Sep 4, 2026 | Gilbert Cisneros D |
PWR | Purchase | $15,001 - $50,000 | Aug 27, 2026 |
| Sep 4, 2026 | Gilbert Cisneros D |
GS | Purchase | $1,001 - $15,000 | Aug 26, 2026 |
| Sep 4, 2026 | Gilbert Cisneros D |
PHR | Sale | $1,001 - $15,000 | Aug 26, 2026 |
| Sep 4, 2026 | Gilbert Cisneros D |
WMT | Purchase | $1,001 - $15,000 | Aug 26, 2026 |
| Sep 4, 2026 | Gilbert Cisneros D |
WPM | Purchase | $1,001 - $15,000 | Aug 26, 2026 |
| Sep 4, 2026 | Gilbert Cisneros D |
LAMR | Sale | $15,001 - $50,000 | Aug 25, 2026 |
| Sep 4, 2026 | Gilbert Cisneros D |
AGIO | Purchase | $1,001 - $15,000 | Aug 20, 2026 |
| Sep 4, 2026 | Gilbert Cisneros D |
AORT | Purchase | $1,001 - $15,000 | Aug 20, 2026 |
| Sep 4, 2026 | Gilbert Cisneros D |
ATRC | Purchase | $1,001 - $15,000 | Aug 20, 2026 |
| Sep 4, 2026 | Gilbert Cisneros D |
CECO | Purchase | $1,001 - $15,000 | Aug 20, 2026 |
| Sep 4, 2026 | Gilbert Cisneros D |
HMN | Purchase | $1,001 - $15,000 | Aug 20, 2026 |
| Sep 4, 2026 | Gilbert Cisneros D |
KMX | Purchase | $1,001 - $15,000 | Aug 19, 2026 |
| Sep 4, 2026 | Gilbert Cisneros D |
CDW | Purchase | $1,001 - $15,000 | Aug 19, 2026 |
| Sep 4, 2026 | Gilbert Cisneros D |
CSGP | Purchase | $1,001 - $15,000 | Aug 19, 2026 |
| Sep 4, 2026 | Gilbert Cisneros D |
DLTR | Sale | $15,001 - $50,000 | Aug 19, 2026 |
| Sep 4, 2026 | Gilbert Cisneros D |
FSV | Purchase | $1,001 - $15,000 | Aug 19, 2026 |
| Sep 4, 2026 | Gilbert Cisneros D |
GMED | Purchase | $15,001 - $50,000 | Aug 19, 2026 |
| Sep 4, 2026 | Gilbert Cisneros D |
APH | Purchase | $1,001 - $15,000 | Aug 18, 2026 |
| Sep 4, 2026 | Gilbert Cisneros D |
BSX | Purchase | $1,001 - $15,000 | Aug 18, 2026 |
| Sep 4, 2026 | Gilbert Cisneros D |
COHR | Sale | $1,001 - $15,000 | Aug 18, 2026 |
| Sep 4, 2026 | Gilbert Cisneros D |
COIN | Sale | $1,001 - $15,000 | Aug 18, 2026 |
| Sep 4, 2026 | Gilbert Cisneros D |
PODD | Purchase | $1,001 - $15,000 | Aug 18, 2026 |
| Sep 4, 2026 | Gilbert Cisneros D |
IBM | Purchase | $1,001 - $15,000 | Aug 18, 2026 |
| Sep 4, 2026 | Gilbert Cisneros D |
INTU | Purchase | $1,001 - $15,000 | Aug 18, 2026 |
| Sep 4, 2026 | Gilbert Cisneros D |
MSFT | Purchase | $15,001 - $50,000 | Aug 18, 2026 |
| Sep 4, 2026 | Gilbert Cisneros D |
TTD | Purchase | $1,001 - $15,000 | Aug 18, 2026 |
| Sep 4, 2026 | Gilbert Cisneros D |
TYL | Purchase | $1,001 - $15,000 | Aug 18, 2026 |
| Sep 4, 2026 | Gilbert Cisneros D |
WDAY | Purchase | $1,001 - $15,000 | Aug 18, 2026 |
| Sep 4, 2026 | Gilbert Cisneros D |
SHAK | Purchase | $1,001 - $15,000 | Aug 11, 2026 |
| Sep 4, 2026 | Gilbert Cisneros D |
HLI | Purchase | $1,001 - $15,000 | Aug 7, 2026 |
| Sep 4, 2026 | Gilbert Cisneros D |
NEO | Purchase | $1,001 - $15,000 | Aug 7, 2026 |
| Sep 4, 2026 | Gilbert Cisneros D |
SKHY | Purchase | $1,001 - $15,000 | Aug 7, 2026 |
| Sep 4, 2026 | Gilbert Cisneros D |
SNOW | Purchase | $1,001 - $15,000 | Aug 7, 2026 |
Most active traders






Most-traded stocks
How this tracker works
The STOCK Act of 2012 requires members of the US Congress to publicly disclose stock transactions made by themselves, their spouses, or dependent children within 45 days. We aggregate the House Clerk's official Periodic Transaction Report filings, normalize them, and compute the per-member and per-stock statistics you see across this section. Every row links back to the original government filing so you can verify it yourself.
Trades are reported as dollar ranges (for example, "$1,001 – $15,000"), not exact figures, so the volume estimates here use the midpoint of each disclosed range. This is informational, not investment advice, and disclosures can contain filer errors.
Source: US House Clerk Periodic Transaction Reports. Tickerpine is not affiliated with the US government. Data may be delayed or contain filer errors — always verify against the linked filing. Not investment advice.