
David E. Price
David E. Price is a Democrat member of the U.S. House of Representatives from NC. Across the disclosures we track, David E. Price has reported 60 stock trades — 39 purchases and 15 sales — worth an estimated $489,522 at the midpoints of the disclosed ranges, leaning heavily toward buying. The most frequently traded position is DIS (The Walt Disney Company), appearing in 4 disclosures. The most recent disclosed transaction was on Mar 17, 2022. Under the STOCK Act, members must report trades within 45 days — each row below links to the original House filing.
David E. Price's trading activity
David E. Price's disclosed trades
| Disclosed | Traded | Ticker | Type | Amount | Since disclosed | Owner | |
|---|---|---|---|---|---|---|---|
| Mar 31, 2022 | Mar 17, 2022 | YUMC | Sale | $1,001 - $15,000 | — | Self | filing ↗ |
| Mar 31, 2022 | Mar 17, 2022 | YUMC | Sale | $1,001 | — | Self | filing ↗ |
| Feb 21, 2022 | Feb 16, 2022 | YUM | Purchase | $1,001 - $15,000 | +23.3% | Self | filing ↗ |
| Dec 14, 2020 | Dec 7, 2020 | BGG | Sale | $21.00 | — | Self | filing ↗ |
| Nov 2, 2020 | Oct 26, 2020 | TXN | Purchase | $1,001 - $15,000 | +102.1% | Self | filing ↗ |
| May 7, 2020 | Apr 7, 2020 | CARR | Exchange | $1,001 - $15,000 | — | Self | filing ↗ |
| May 7, 2020 | Apr 7, 2020 | RTX | Exchange | $15,001 - $50,000 | — | Self | filing ↗ |
| Mar 16, 2020 | Mar 13, 2020 | HD | Purchase | $1,001 - $15,000 | +84.3% | Self | filing ↗ |
| Mar 16, 2020 | Mar 13, 2020 | PRU | Purchase | $1,001 - $15,000 | +218.7% | Self | filing ↗ |
| Feb 3, 2020 | Jan 30, 2020 | PRU | Purchase | $1,001 - $15,000 | +120.2% | Self | filing ↗ |
| Aug 19, 2019 | Aug 15, 2019 | EMR | Purchase | $1,001 - $15,000 | +209.1% | Self | filing ↗ |
| Jul 2, 2019 | Jun 28, 2019 | KTB | Sale | $1,001 - $15,000 | — | Self | filing ↗ |
| May 28, 2019 | May 28, 2019 | KTB | Exchange | $1,001 - $15,000 | — | Self | filing ↗ |
| Jan 7, 2019 | Jan 3, 2019 | AAPL | Purchase | $1,001 - $15,000 | +764.4% | Self | filing ↗ |
| Jan 2, 2019 | Dec 27, 2018 | FITB | Sale | $1,001 - $15,000 | — | Self | filing ↗ |
| Dec 26, 2018 | Dec 21, 2018 | CAT | Purchase | $1,001 - $15,000 | +657.8% | Self | filing ↗ |
| Nov 24, 2018 | Nov 20, 2018 | CRM | Purchase | $1,001 - $15,000 | +67.1% | Self | filing ↗ |
| Nov 16, 2018 | Nov 8, 2018 | REZI | Purchase | $1,001 - $15,000 | — | Self | filing ↗ |
| Aug 28, 2018 | Aug 23, 2018 | MMM | Purchase | $1,001 - $15,000 | +26.5% | Self | filing ↗ |
| May 9, 2018 | May 2, 2018 | PYPL | Purchase | $1,001 - $15,000 | −32.2% | Joint | filing ↗ |
| Feb 8, 2018 | Feb 5, 2018 | HON | Purchase | $1,001 - $15,000 | +76.7% | Self | filing ↗ |
| Jan 29, 2018 | Jan 23, 2018 | AAPL | Purchase | $1,001 - $15,000 | +772.2% | Self | filing ↗ |
| Jan 29, 2018 | Jan 23, 2018 | PYPL | Purchase | $1,001 - $15,000 | −34.8% | Self | filing ↗ |
| Nov 29, 2017 | Nov 24, 2017 | AA | Sale | $1,001 - $15,000 | — | Self | filing ↗ |
| Nov 29, 2017 | Nov 24, 2017 | BHF | Sale | $1,001 - $15,000 | — | Self | filing ↗ |
| Nov 29, 2017 | Nov 24, 2017 | CRM | Purchase | $1,001 - $15,000 | +128.6% | Self | filing ↗ |
| Nov 29, 2017 | Nov 24, 2017 | TUES | Sale | $1,001 - $15,000 | — | Self | filing ↗ |
| Oct 6, 2017 | Sep 13, 2017 | SPLS | Sale | $1,001 - $15,000 | — | Self | filing ↗ |
| Sep 8, 2017 | Aug 10, 2017 | BHF | Exchange | $1,001 - $15,000 | — | Self | filing ↗ |
| Jun 29, 2017 | Jun 22, 2017 | DVN | Sale | $1,001 - $15,000 | — | Self | filing ↗ |
| Jun 2, 2017 | May 23, 2017 | AMT | Purchase | $1,001 - $15,000 | +61.5% | Self | filing ↗ |
| Dec 27, 2016 | Dec 19, 2016 | TMO | Purchase | $1,001 - $15,000 | +391.6% | Self | filing ↗ |
| Dec 6, 2016 | Nov 1, 2016 | ARNC | Exchange | $1,001 - $15,000 | — | Self | filing ↗ |
| Nov 7, 2016 | Oct 6, 2016 | VSM | Exchange | $1,001 - $15,000 | — | Self | filing ↗ |
| Oct 20, 2016 | Oct 13, 2016 | TMO | Purchase | $1,001 - $15,000 | +372.3% | Self | filing ↗ |
| Aug 9, 2016 | Aug 4, 2016 | DIS | Purchase | $1,001 - $15,000 | +22.0% | Self | filing ↗ |
| Aug 8, 2016 | Aug 3, 2016 | AMT | Purchase | $1,001 - $15,000 | +92.3% | Self | filing ↗ |
| Aug 8, 2016 | Aug 3, 2016 | MET | Purchase | $1,001 - $15,000 | +252.9% | Self | filing ↗ |
| Aug 8, 2016 | Aug 3, 2016 | TMO | Purchase | $1,001 - $15,000 | +356.7% | Self | filing ↗ |
| Aug 6, 2016 | Jul 1, 2016 | TECO | Sale | $1,001 - $15,000 | — | Self | filing ↗ |
| May 13, 2016 | May 6, 2016 | COST | Purchase | $1,001 - $15,000 | +636.2% | Self | filing ↗ |
| Jan 21, 2016 | Jan 14, 2016 | AAPL | Purchase | $1,001 - $15,000 | +1458.3% | Self | filing ↗ |
| Jan 21, 2016 | Jan 14, 2016 | MET | Purchase | $1,001 - $15,000 | +252.4% | Self | filing ↗ |
| Jan 11, 2016 | Jan 5, 2016 | DIS | Purchase | $1,001 - $15,000 | +21.1% | Self | filing ↗ |
| Dec 28, 2015 | Dec 23, 2015 | TCB | Sale | $1,001 - $15,000 | — | Self | filing ↗ |
| Oct 14, 2015 | Oct 8, 2015 | VRX | Sale | $1,001 - $15,000 | — | Self | filing ↗ |
| Sep 28, 2015 | Sep 23, 2015 | LNC | Purchase | $1,001 - $15,000 | — | Joint | filing ↗ |
| Sep 28, 2015 | Sep 23, 2015 | MET | Purchase | $1,001 - $15,000 | +236.2% | Joint | filing ↗ |
| Sep 3, 2015 | Aug 28, 2015 | DIS | Purchase | $1,001 - $15,000 | +14.3% | Joint | filing ↗ |
| Aug 31, 2015 | Aug 24, 2015 | COST | Purchase | $1,001 - $15,000 | +688.5% | Joint | filing ↗ |
| Jul 27, 2015 | Jul 24, 2015 | DIS | Purchase | $1,001 - $15,000 | −2.7% | Joint | filing ↗ |
| Feb 6, 2015 | Jan 29, 2015 | MMP | Purchase | $1,001 - $15,000 | — | Joint | filing ↗ |
| Feb 2, 2015 | Jan 26, 2015 | SDY | Purchase | $1,001 - $15,000 | — | Joint | filing ↗ |
| Oct 10, 2014 | Oct 6, 2014 | SDY | Purchase | $1,001 - $15,000 | — | Joint | filing ↗ |
| Aug 18, 2014 | Aug 12, 2014 | GILD | Purchase | $1,001 - $15,000 | +105.6% | Joint | filing ↗ |
| Aug 18, 2014 | Aug 12, 2014 | MMP | Purchase | $1,001 - $15,000 | — | Joint | filing ↗ |
| Aug 18, 2014 | Aug 12, 2014 | MSI | Sale | $1,001 - $15,000 | — | Joint | filing ↗ |
| Aug 18, 2014 | Aug 12, 2014 | VRX | Sale | $1,001 - $15,000 | — | Joint | filing ↗ |
| Jun 23, 2014 | Jun 18, 2014 | COST | Purchase | $1,001 - $15,000 | +904.2% | Joint | filing ↗ |
| Jun 23, 2014 | Jun 18, 2014 | PRU | Purchase | $1,001 - $15,000 | +128.1% | Joint | filing ↗ |
Most-traded stocks
David E. Price's stock trading: frequently asked questions
What stocks does David E. Price trade the most?
David E. Price's most frequently disclosed positions are DIS (The Walt Disney Company, 4 trades), PRU (Prudential Financial, Inc., 3 trades), AAPL (Apple Inc., 3 trades), based on official House financial disclosures.
How many stock trades has David E. Price disclosed?
David E. Price has disclosed 60 stock trades since 2014 — 39 purchases and 15 sales worth an estimated $489,522 at the midpoints of the disclosed ranges.
When did David E. Price last trade stocks?
The most recent transaction David E. Price disclosed was on Mar 17, 2022. Members of Congress must report trades within 45 days under the STOCK Act, so new filings can lag the trade itself.
Is it legal for David E. Price to trade stocks?
Yes — members of Congress may trade stocks, but the 2012 STOCK Act requires them to publicly disclose every trade over $1,000 within 45 days. This page tracks David E. Price's disclosures and links to the original filings.
Other active members of Congress
 Thomas MacArthur
Republican · NJ
1299 trades
Thomas MacArthur
Republican · NJ
1299 trades
 Gilbert Cisneros
Democrat · CA
1280 trades
Gilbert Cisneros
Democrat · CA
1280 trades
 Josh Gottheimer
Democrat · NJ
1163 trades
Josh Gottheimer
Democrat · NJ
1163 trades
 Susie Lee
Democrat · NV
850 trades
Susie Lee
Democrat · NV
850 trades
 Greg Gianforte
Republican · MT
746 trades
Greg Gianforte
Republican · MT
746 trades
 Alan S. Lowenthal
Democrat · CA
687 trades
Alan S. Lowenthal
Democrat · CA
687 trades
 Lisa McClain
Republican · MI
664 trades
Lisa McClain
Republican · MI
664 trades
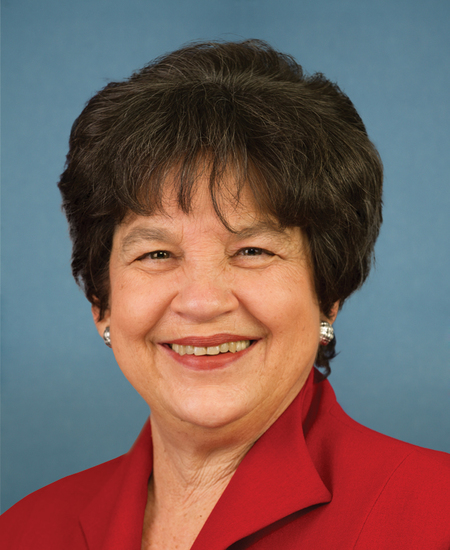 Lois Frankel
Democrat · FL
625 trades
Lois Frankel
Democrat · FL
625 trades
Source: David E. Price's official US House Periodic Transaction Report filings. Amounts are disclosed as ranges; estimates use range midpoints. Data may be delayed or contain filer errors. Updated Sep 28, 2026. Not investment advice.